Digital Marketing
The numbers before and after
We don't report impressions. Every campaign is judged on enquiries, cost per lead and revenue — measured against where the business actually started.

0Campaigns managed
0.0M+Impressions delivered
₹0.00Lowest cost per lead
Campaign proof
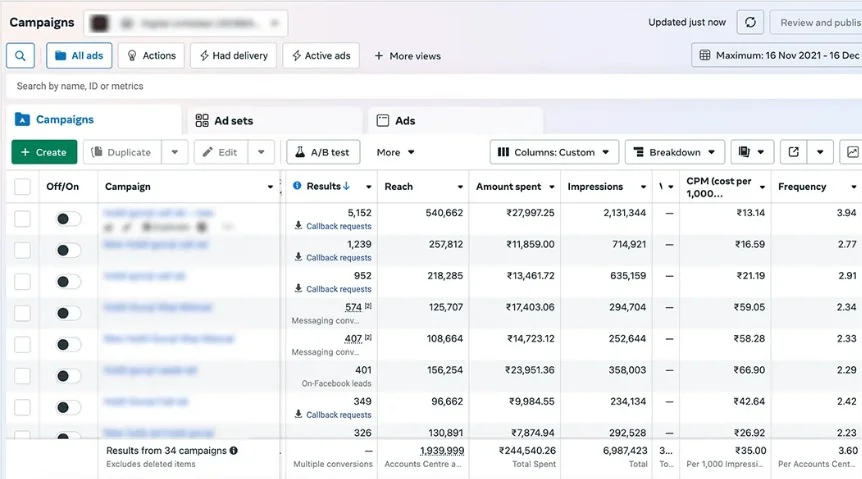
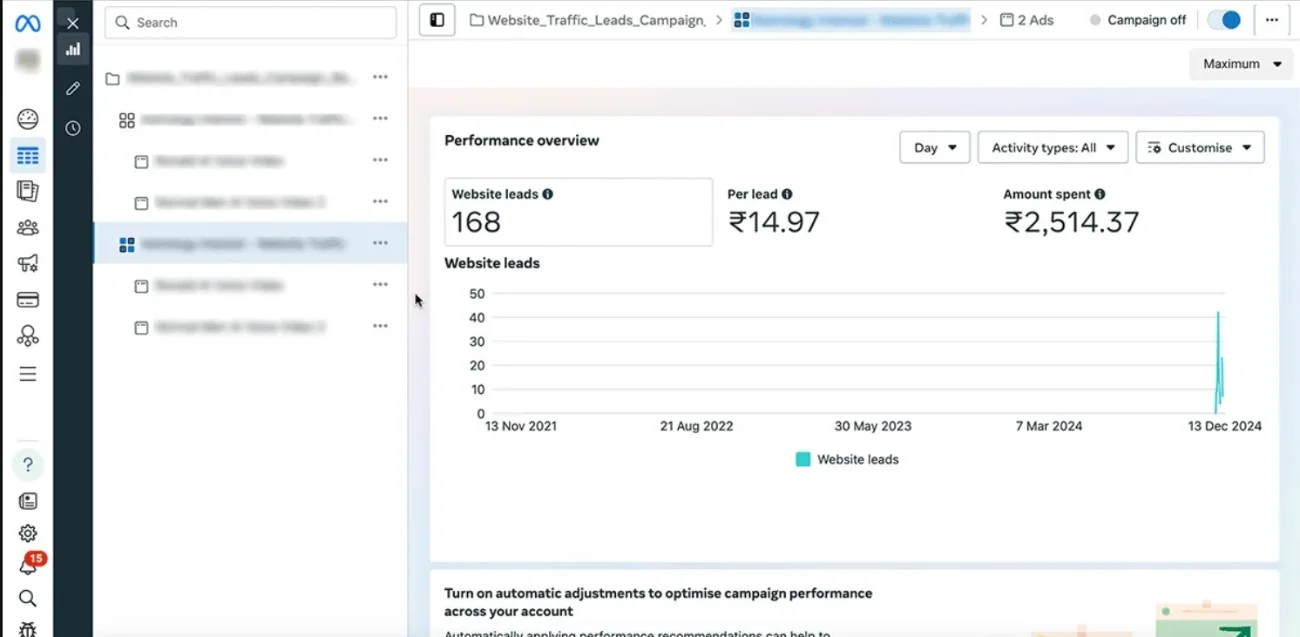
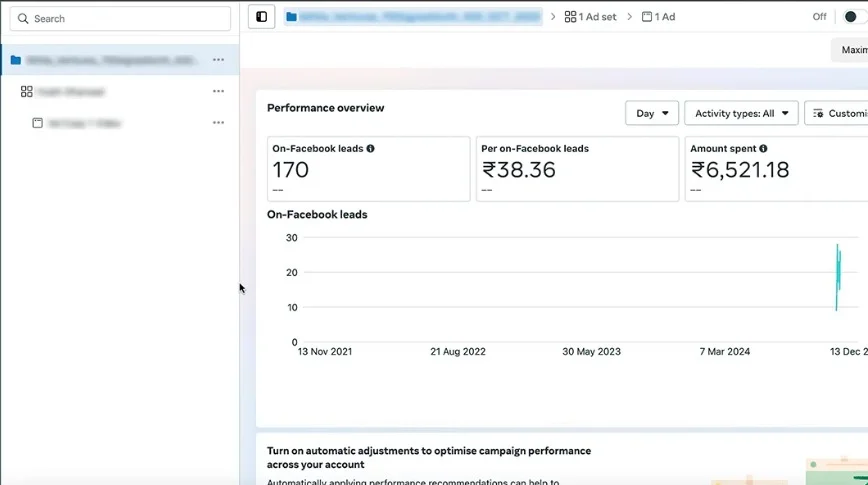
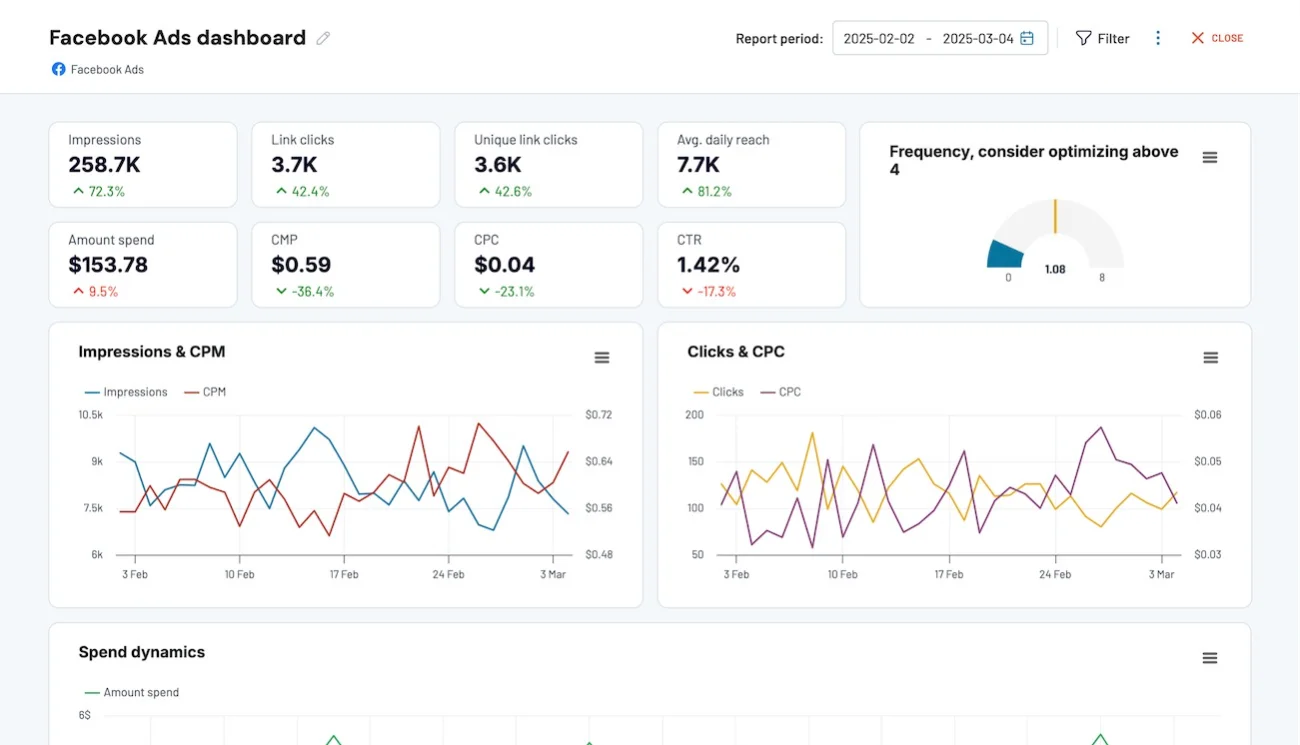
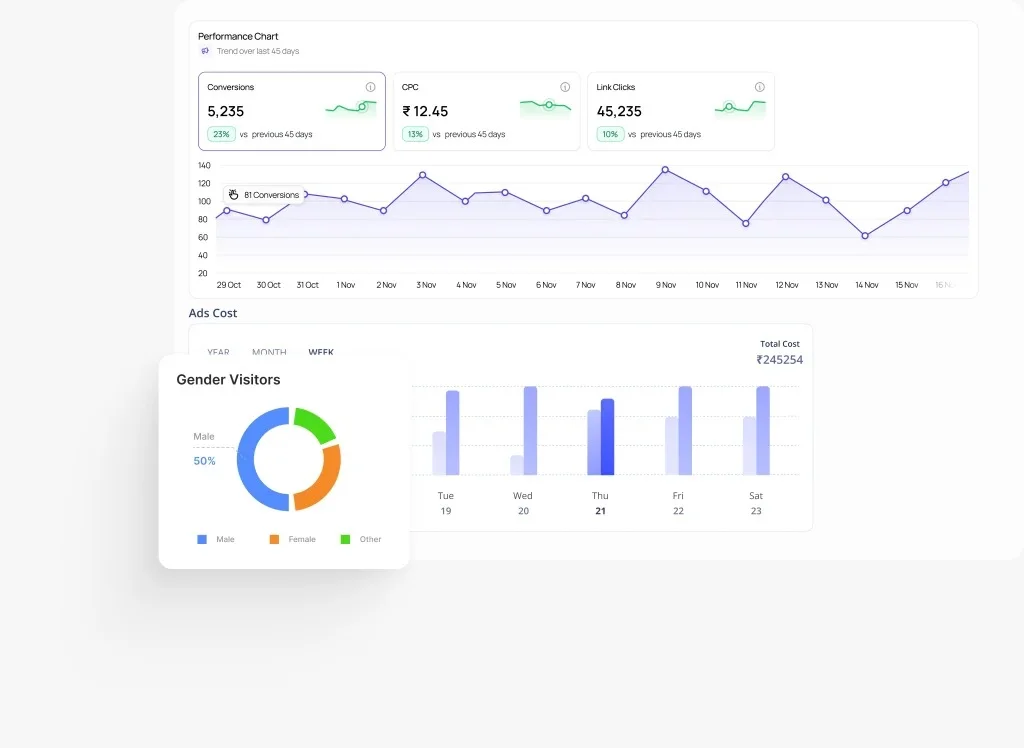
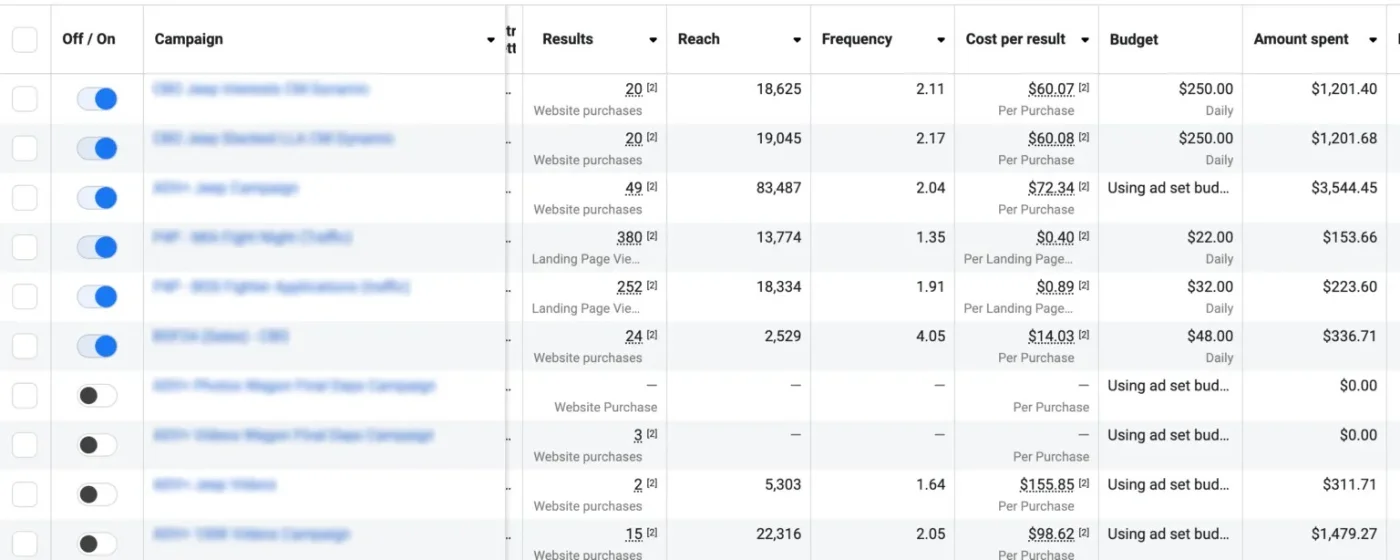
Straight from the ads manager
Exports from live client accounts rather than numbers we typed ourselves. Client names are redacted; every figure quoted below is visible in the screenshot beside it.
Channel mix
Where the budget actually goes
The split shifts per business, but the principle holds: capture the people already searching, stay visible to the ones who aren't yet, and keep both compounding through content.
Google Ads34%
High-intent search capture
Meta Ads28%
Discovery and retargeting
SEO & Content24%
Compounding organic traffic
Email & Nurture14%
Turning interest into enquiries
Want to see your own before and after?
We'll audit what you're running today and show you where the leads are leaking.
Book a call